
How to Build a SaaS Dashboard with AI — No Local Setup Required
A practical step-by-step tutorial: planning data schemas, generating responsive layouts, and shipping interactive dashboards entirely in your browser.
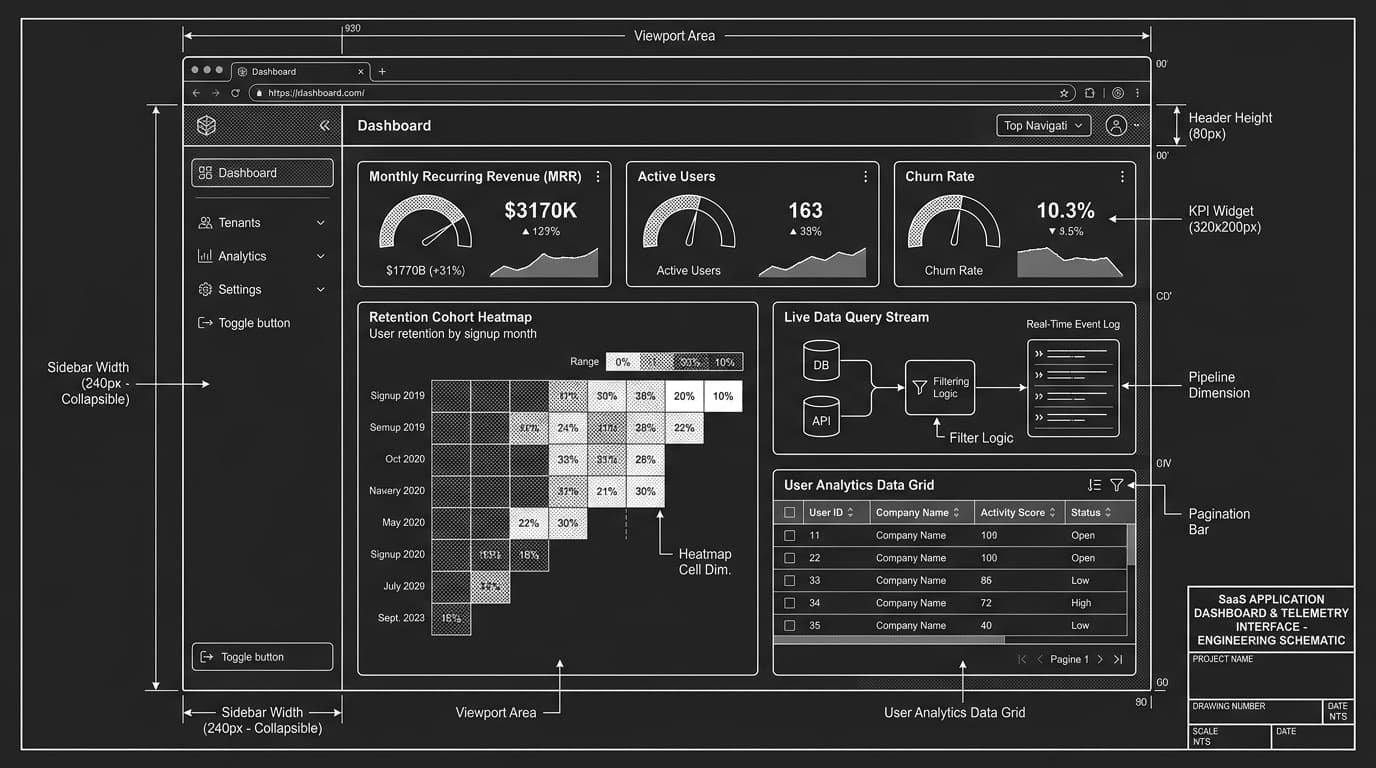
The 4-Phase Dashboard Development Lifecycle
Building a dashboard with AI should follow a disciplined sequence: schema planning first, visual shell second, interactive components third, and live data binding last.
Phase 1: Define Entities, Metrics, and Data Schemas
Before touching styling, define what your dashboard actually tracks. For a B2B SaaS dashboard, identify your core metrics: Monthly Recurring Revenue (MRR), Churn Rate, Active User Cohorts, and Recent Invoices. Writing these definitions into your initial prompt ensures the AI generates realistic state hooks and table columns.
Phase 2: Assemble the Responsive Shell & Navigation
Instruct the builder to generate a responsive layout: a collapsible sidebar navigation rail, a global header with search and user controls, and a main content grid supporting 12-column responsive breakpoints.
Phase 3: Implement Interactive Charts & Filter Controls
Integrate lightweight visualization libraries like Recharts or clean SVG micro-charts. Add date range selectors and status pills that filter the data table in real time.
Phase 4: Export to GitHub & Deploy to Production
Export the generated project directly to your GitHub account. Connect the repository to Vercel, Netlify, or your cloud provider for automated continuous deployment.
Common Pitfalls to Avoid
- ›Overloading the Initial Prompt: Do not ask for 20 features in prompt one. Start with the core layout and metrics, then iteratively prompt for filtering and table pagination.
- ›Ignoring Mobile Breakpoints: Ensure table columns collapse or scroll horizontally on mobile screens, and that the navigation collapses into an accessible mobile drawer.
- ›Hardcoded Mock Arrays: Ensure mock data is extracted into typed JSON fixtures (e.g., data/metrics.ts) rather than declared inline inside render loops.
Building Dashboards with Orbit by Forion
Orbit by Forion was designed specifically for this workflow. With zero local terminal setup, Orbit executes a complete Next.js 15 App Router sandbox directly in your browser. You can click any component to visually annotate edits, connect live PostgreSQL or Snowflake databases via Sources, and export clean, open TypeScript code anytime.
[ CROSS-REFERENCES · RELATED DASHBOARD TOOLS & SOLUTIONS ]
Frequently Asked Questions
- [Q]Can I connect a live database without running a local server?
- Yes. With Orbit Sources, you can connect PostgreSQL, Supabase, or Snowflake via secure read-replica SSL tunnels, allowing your dashboard to reflect real production data directly in the browser preview.
- [Q]How do you customize styling once the dashboard is generated?
- Because Orbit outputs standard Tailwind CSS classes and shadcn/ui primitives, you can edit Tailwind tokens visually or refactor the exported repository in your preferred local IDE.
Build with Orbit AI Developer Workspace
Connect live databases, generate native Expo mobile codebases, and eliminate fragmented subscriptions inside one continuous environment.